
이전 글 :
2025.02.20 - [모니터링] - [모니터링] Prometheus와 Grafana를 이용한 서버 모니터링 (1. 개념 정리)
2025.05. 17 - [모니터링] - [모니터링] Prometheus와 Grafana를 이용한 서버 모니터링 (2. node-exporter, prometheus 설치 가이드)
이전 글에서는 Prometheus로 모니터링에 대한 기본 개념과 설치 방법에 대해서 정리했다면 이번 글에서는 Prometheus와 node-exporter를 연동하는 방법에 대해서 정리해보도록 하겠다.
1. Node-Exporter 설정
Node-Exporter에 대한 설정은 service 파일에서 설정하는 것이 필요하다. 이 파일은 설치 시 이미 작성했으므로 패스
1. systemd 서비스 파일 (이전글 동일)
cat <<EOF | tee /etc/systemd/system/node-exporter.service
[Unit]
Description=Node Exporter
After=network.target

[Service]
User=root
ExecStart=/usr/local/bin/node_exporter # 실행 파일 경로
--web.listen-address=0.0.0.0:9100 # 프로메테우스 접근 포트
Restart=always

[Install]
WantedBy=multi-user.target EOF
2. Prometheus 설정
Prometheus 과 관련된 파일은 3가지가 있다.
- 서비스 파일 : prometheus.service
- 실행 파일 : prometheus
- config 파일 : prometheus.yml
이 중 서비스 파일은 설치 시 작성하였기 때문에 패스 하고 config 파일만 작성해주도록 하겠다.
1. Prometheus 서비스 파일 설정(이전글 동일)
tee /etc/systemd/system/prometheus.service <<EOF

[Unit]
Description=Prometheus
Wants=network-online.target
After=network-online.target

[Service]
User=root
Group=root
Type=simple
ExecStart=/usr/local/bin/prometheus \\ # 실행 파일 경로
--config.file=/etc/prometheus/prometheus.yml \\ # 설정 파일 경로
--storage.tsdb.path=/var/lib/prometheus \\ # 스토리지 경로 (메트릭 수집 정보)
--web.listen-address="0.0.0.0:9090" # 이용자 or Grafana 포트

[Install] WantedBy=multi-user.target EOF
2. config 파일 설정(설정 파일 상 /etc/prometheus/prometheus.yml 경로)
# my global config     전역 설정
global:
  scrape_interval: 5s   # 수집(Scrape) 주기 : default 1분
  evaluation_interval: 5s  # 평가(evaluation) 주기 : default 1분
						# 평가 주기 : 알람이나 룰을 실행시키는 주기

# Alertmanager configuration     알람 설정
alerting:
  alertmanagers:
    - static_configs:
        - targets:
          # - alertmanager:9093

# Load rules once and periodically evaluate them according to the global 'evaluation_interval'.
rule_files:
  # - "first_rules.yml"
  # - "second_rules.yml"

# A scrape configuration containing exactly one endpoint to scrape:
# Here it's Prometheus itself.
scrape_configs:      # 메트릭 수집 설정
  - job_name: 'maria-node'
    static_configs:
      - targets: ['/*여기에 IP주소:포트 주소*/ ']  # 타겟 node-Exporter 정보
3. 설정 정보 입력 후 프로세스 재실행
systemctl daemon-reload         # 설정 내용 로드
systemctl restart prometheus    # 서비스 시작
4. 완료 후 웹 대시보드 접근하여 확인
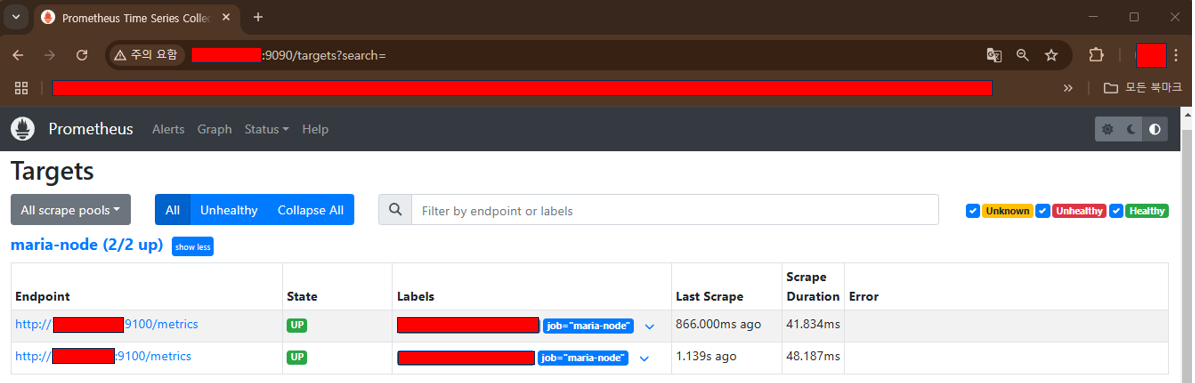
위에서 보는 것처럼 State란을 통해 연결이 잘 된 것을 확인할 수가 있다. 여기까지가 기본적으로 Exporter와 Prometheus를 통한 설치 및 연동 과정을 살펴보았다. Prometheus 웹 콘솔에서도 실제 메트릭 값을 확인할 수 있지만 그래프 등을 이용해 가시적으로 보기 좋게 표현하기 위해 오픈 소스인 Grafana를 주로 사용한다. 다음 글에서는 Grafana와의 연동해 보는 것으로 마무리하도록 하겠다.
'모니터링' 카테고리의 다른 글
| [모니터링] Prometheus와 Grafana를 이용한 서버 모니터링 (2. node exporter, Prometheus 설치 가이드) (0) | 2025.05.17 |
|---|---|
| [모니터링] Prometheus와 Grafana를 이용한 서버 모니터링 (1. 개념 정리) (0) | 2025.02.20 |